Your Monthly Window Into the Future of Global Markets
On the 1st of every month, we deliver monthly forecast graphs for over 68 major global assets directly to our subscribers. These forecasts provide a clear, visual roadmap of how each asset is likely to trend in the upcoming month — helping you stay ahead of the curve with confidence.
Throughout the month, we combine trend and price forecasts to provide actionable trading strategies. But if you’re only interested in the monthly trend forecast graphs, you have the option to choose from a wide range of assets. You can select any market and request forecasts up to December 31st of the current calendar year.
Below are samples of the two types of monthly forecast graphs we provide:
Trend Top-Bottom Forecast Graph
• Visualized using red and blue projection lines
• Red marks the expected top, blue indicates the bottom
Day-Wise Trend Forecast Graph
• Displayed with green and red arrow markers
• Green arrows indicate an uptrend, red arrows a downtrend
• The intersection of red and blue arrows highlights dual trend periods
By analyzing both graphs together, you gain a clear picture of when a specific asset is likely to move. When both the TTB graph and Arrow graph align during a particular time window, the probability of movement in that predicted direction is significantly higher.
Please note:
- These graphs reflect trend direction only — no price levels are included
- While highly reliable, accuracy is not 100%
- METALS: Gold, Silver, Copper,
- ENERGY: Crude Oil, Natural Gas.
- SOFT COMMODITIES: Coffee, Cotton, Sugar,
- GRAINS: Corn, Wheat, Soybean,
- STOCK INDICES: Nifty, Bank Nifty, Nifty 500, S&P, Dow, Nasdaq. Wilshire, Nikkei
- CURRENCIES: US Dollar Index, EUROUSD, GBPUSD, USDJPY, USDINR.
- TREASURY BOND: US 10 years yield. India 10yr Yield
- CRYPTO CURRENCY : Bitcoin,
- VIX : S&P VIX & India VIX
- STOCKS: NSE Stocks & NYSE Stocks
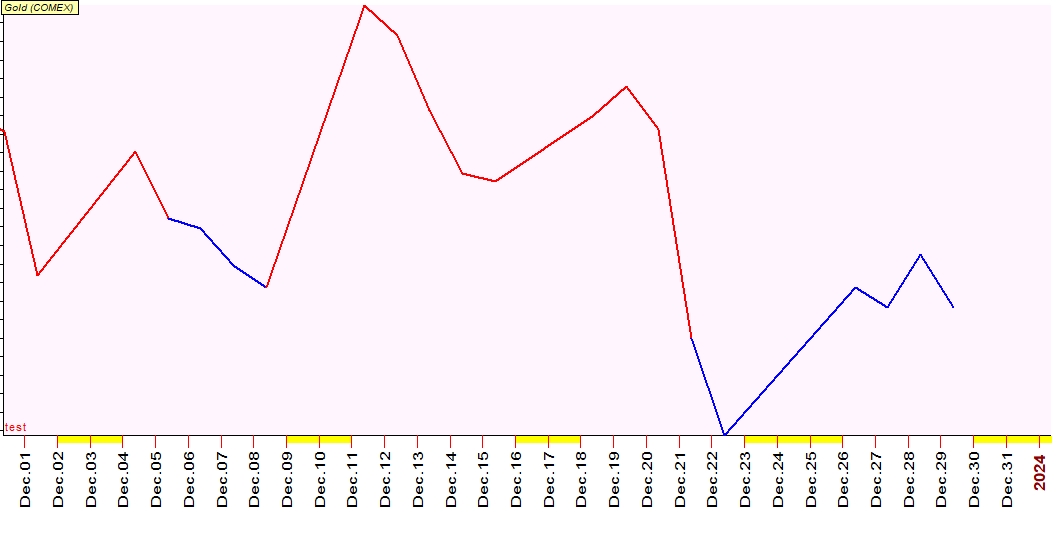
Gold Trend-Top-Bottom Forecast Graph December,2023
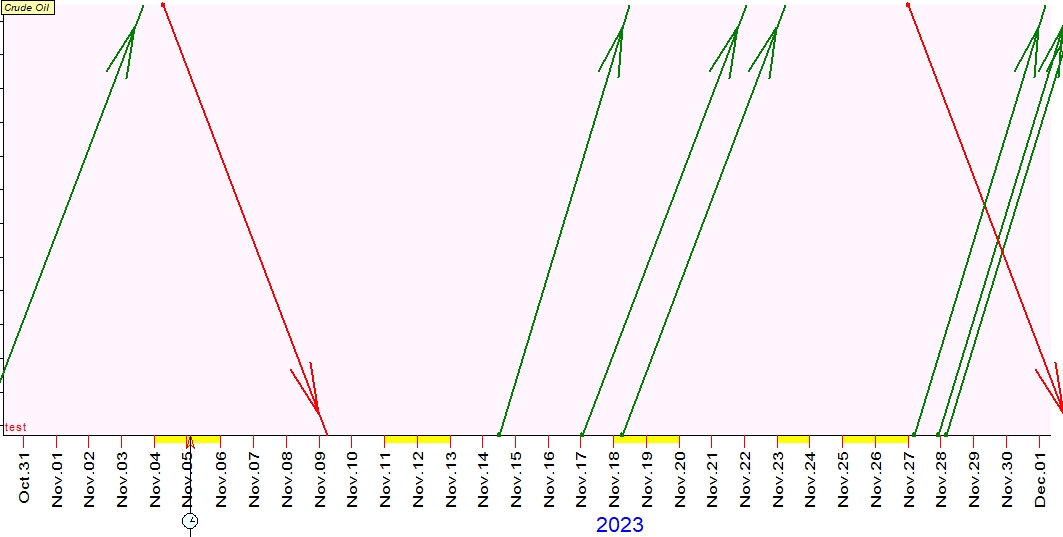
Crude Oil Day-wise trend forecast arrow graph for November, 2023
SUBSCRIPTION FEE
For International Client
Any 1 market / 1 month period / Any 1 graph $105

SUBSCRIPTION FEE
For Indian Client
Any 1 market / 1 month period / Any 1 graph Rs. 9450 + GST 18%