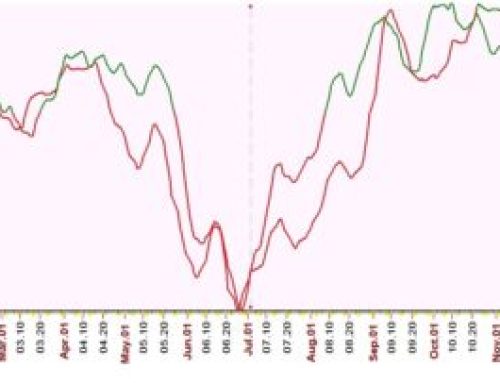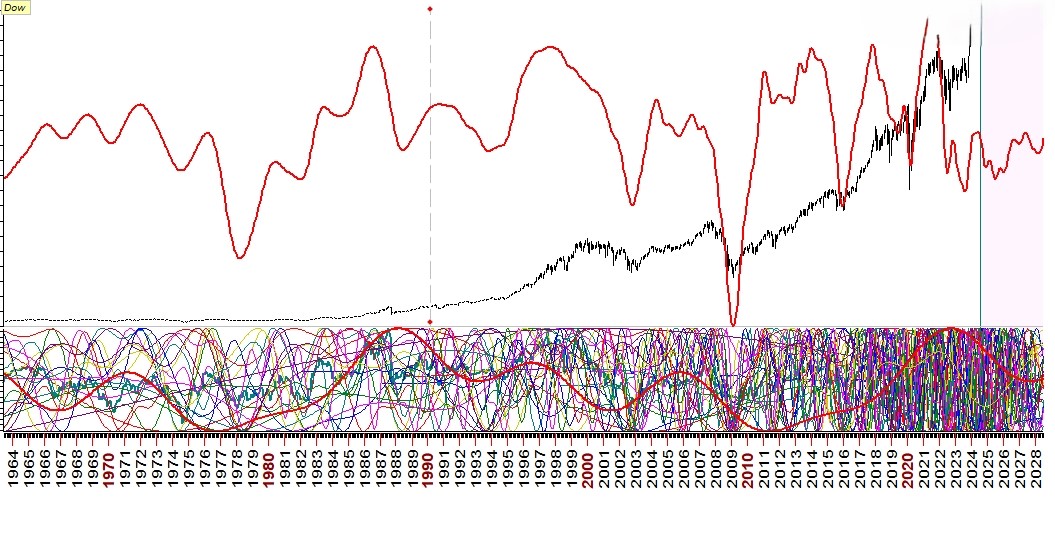
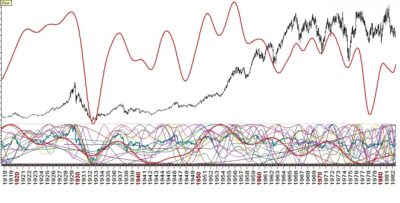
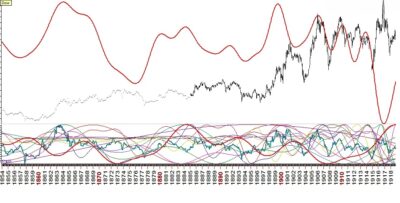
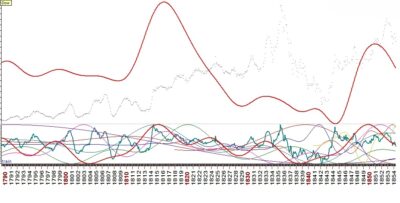
Today i would like to share long term analysis of Dow jones
Graphs are self explanatory
To prepare this i have used historical data of Dow jones since year 1789 & forecast is up to year 2030
calculations are based on permanent dominating cycles
hope you find this useful
best wishes